
StatLite
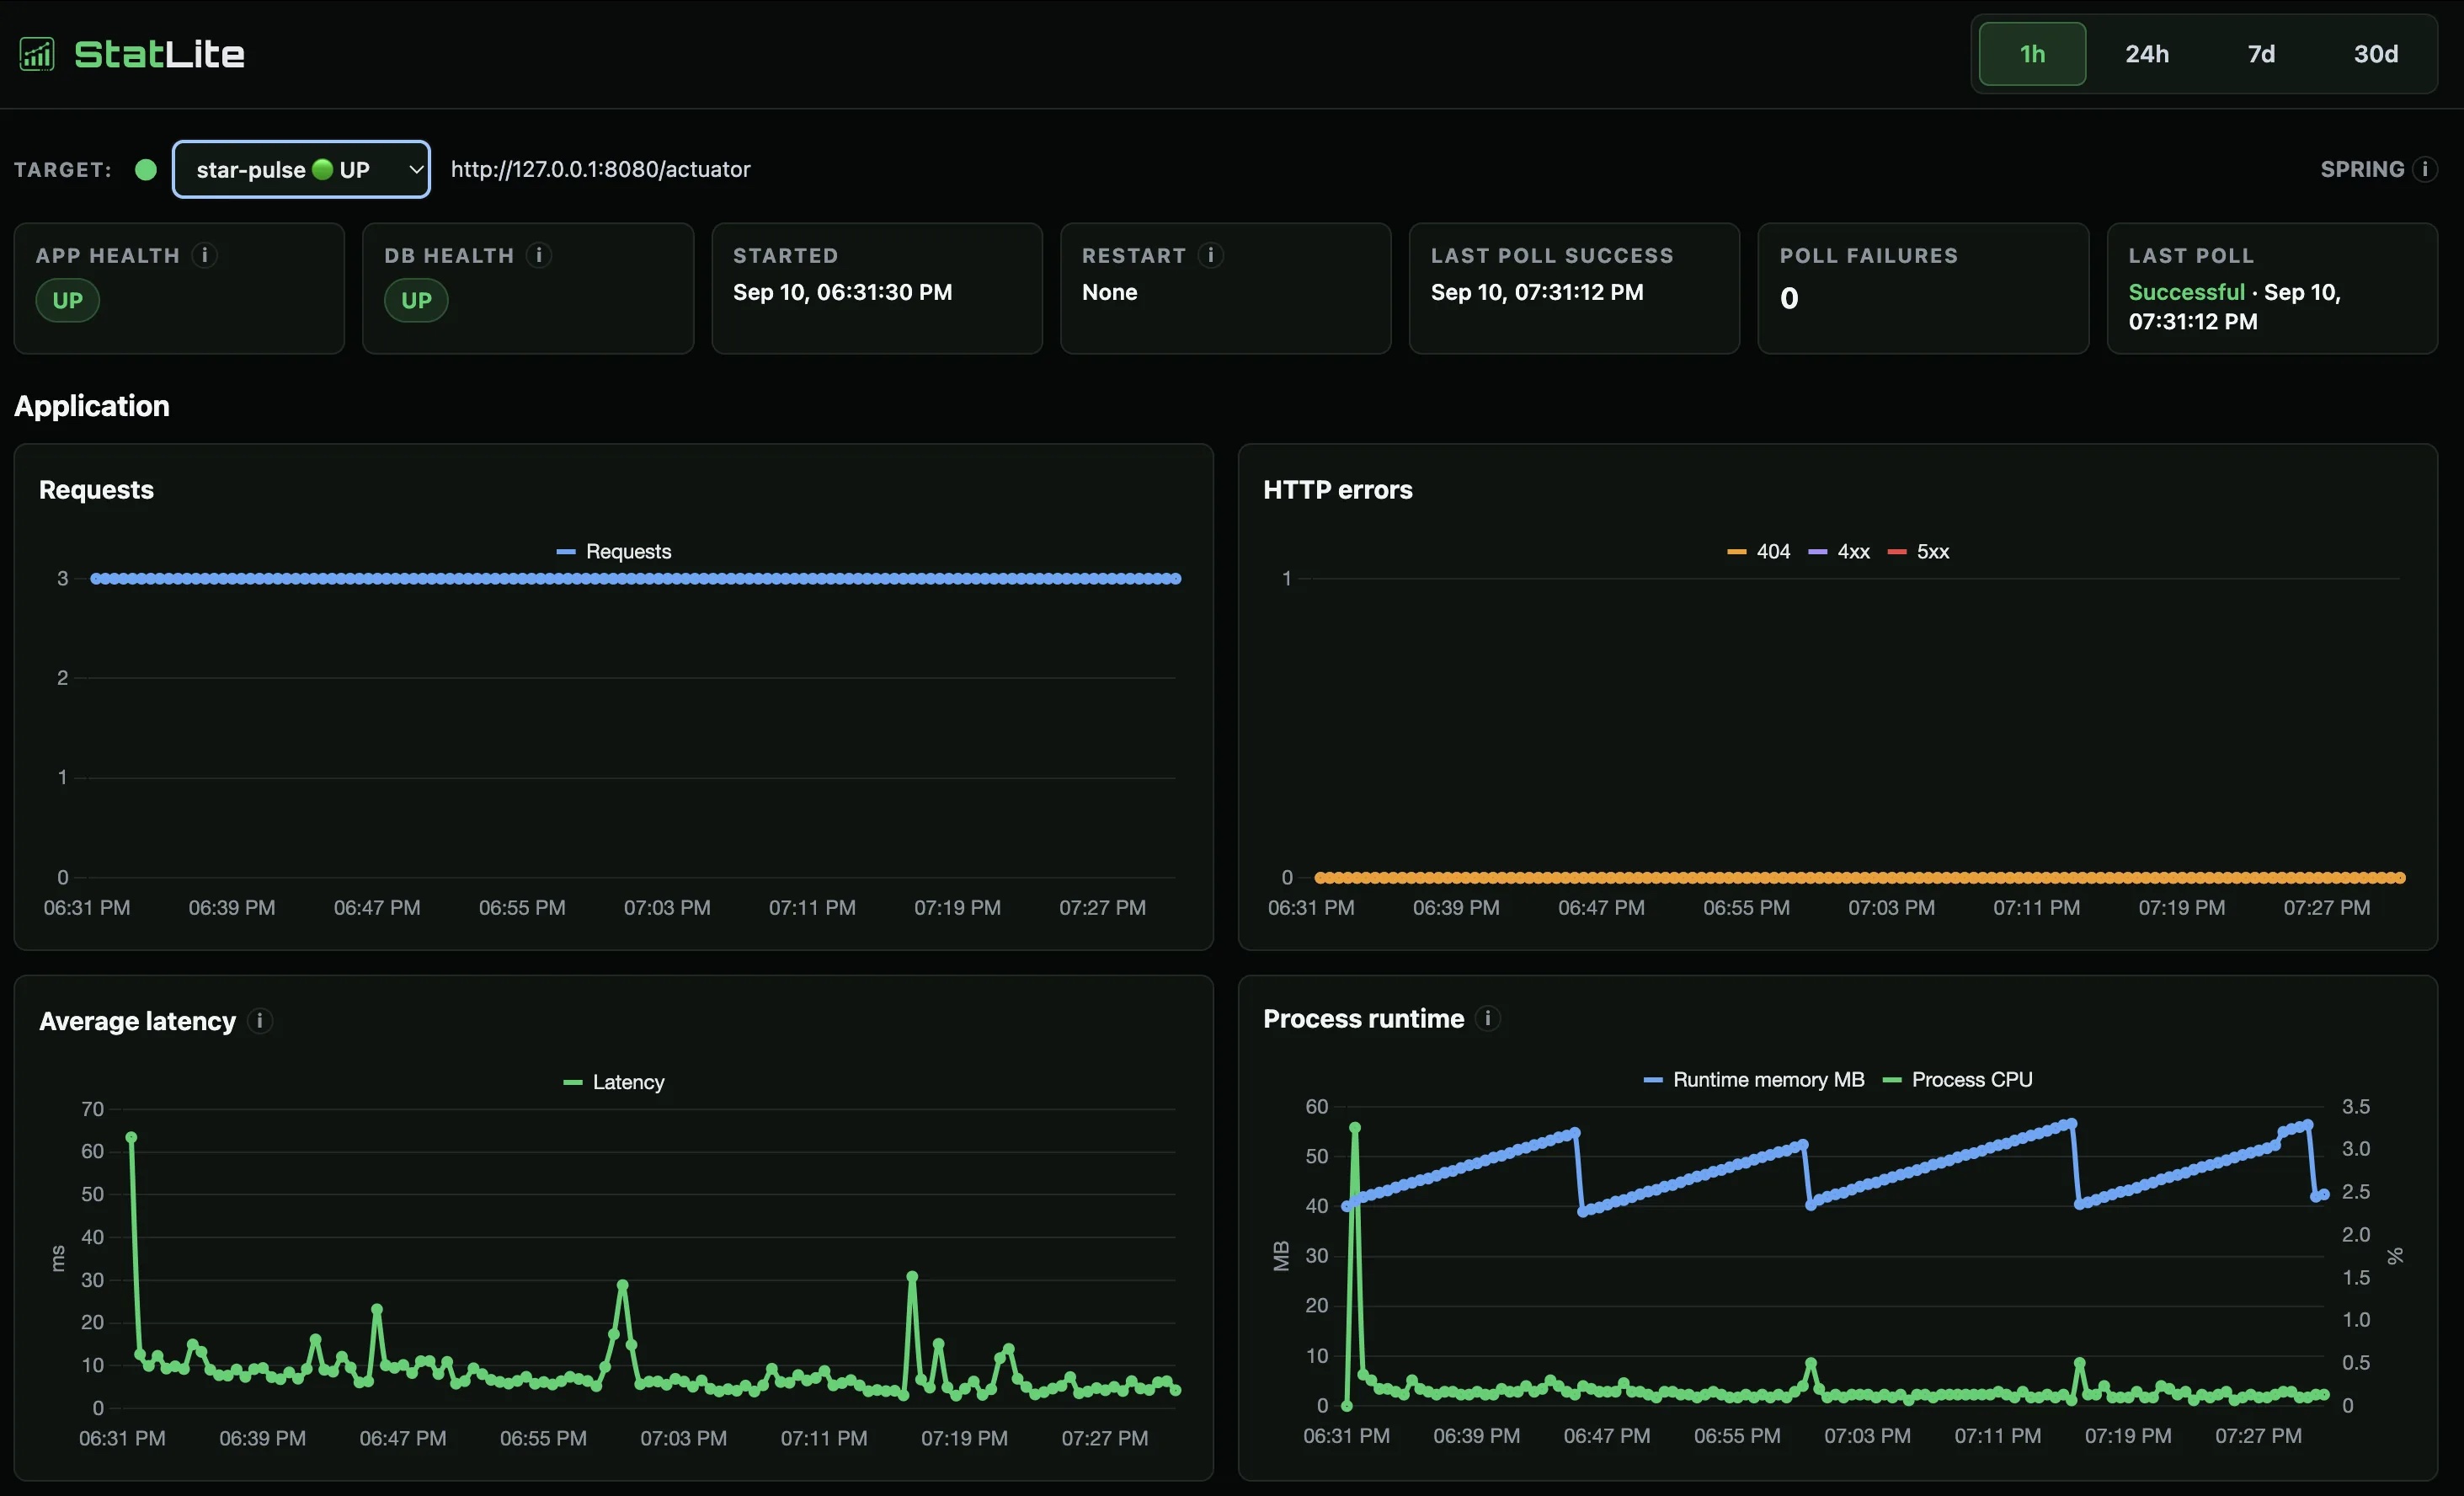
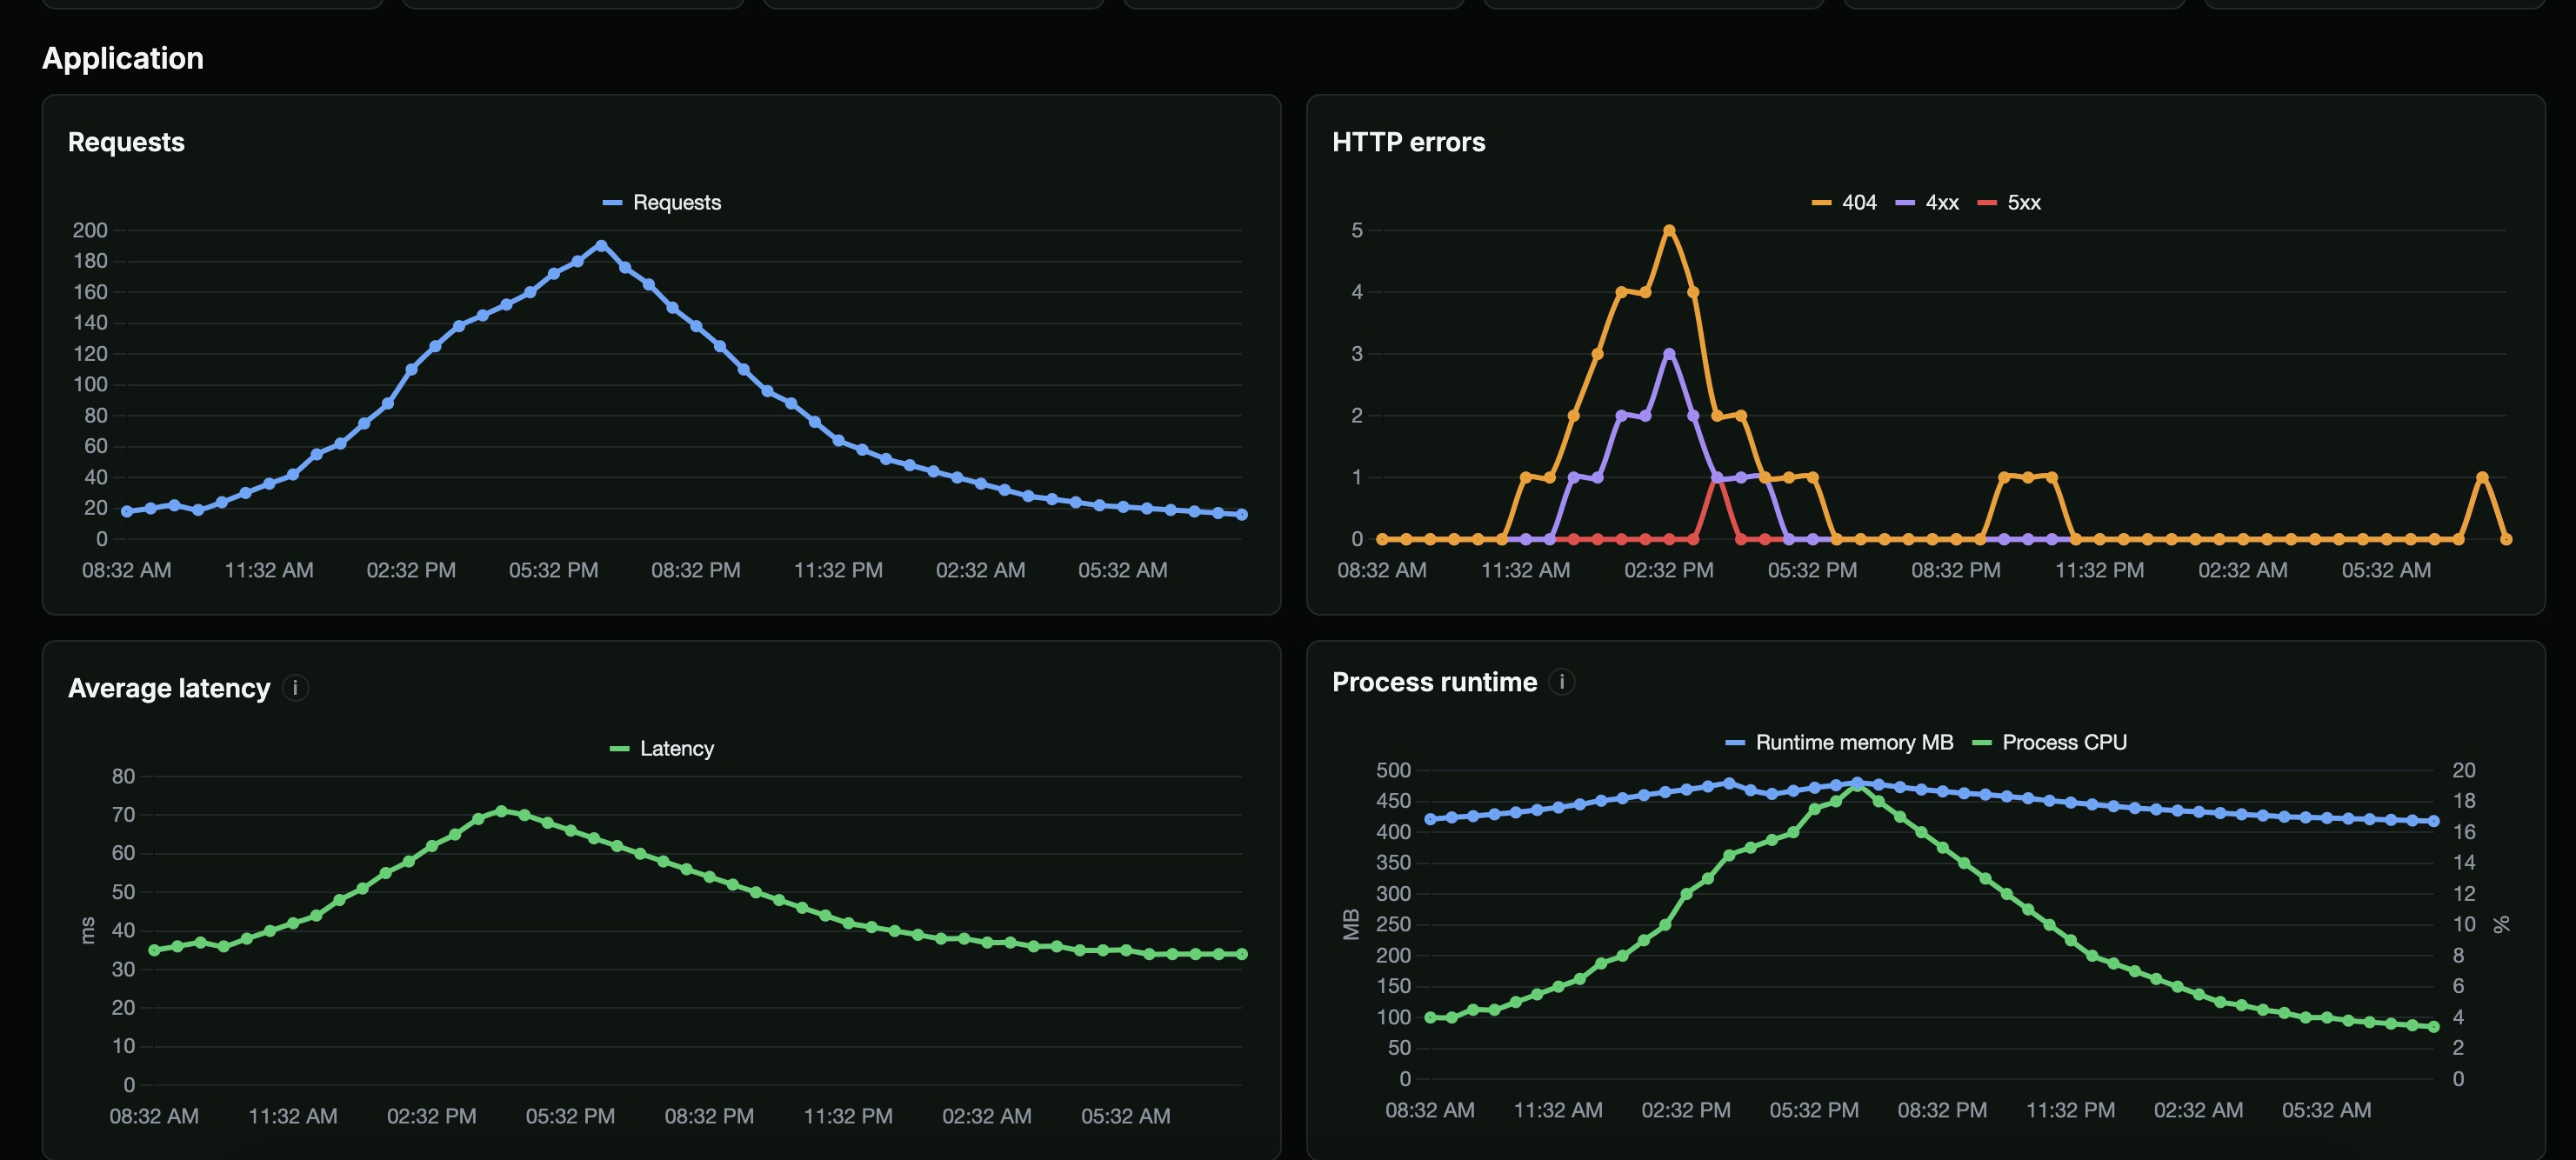
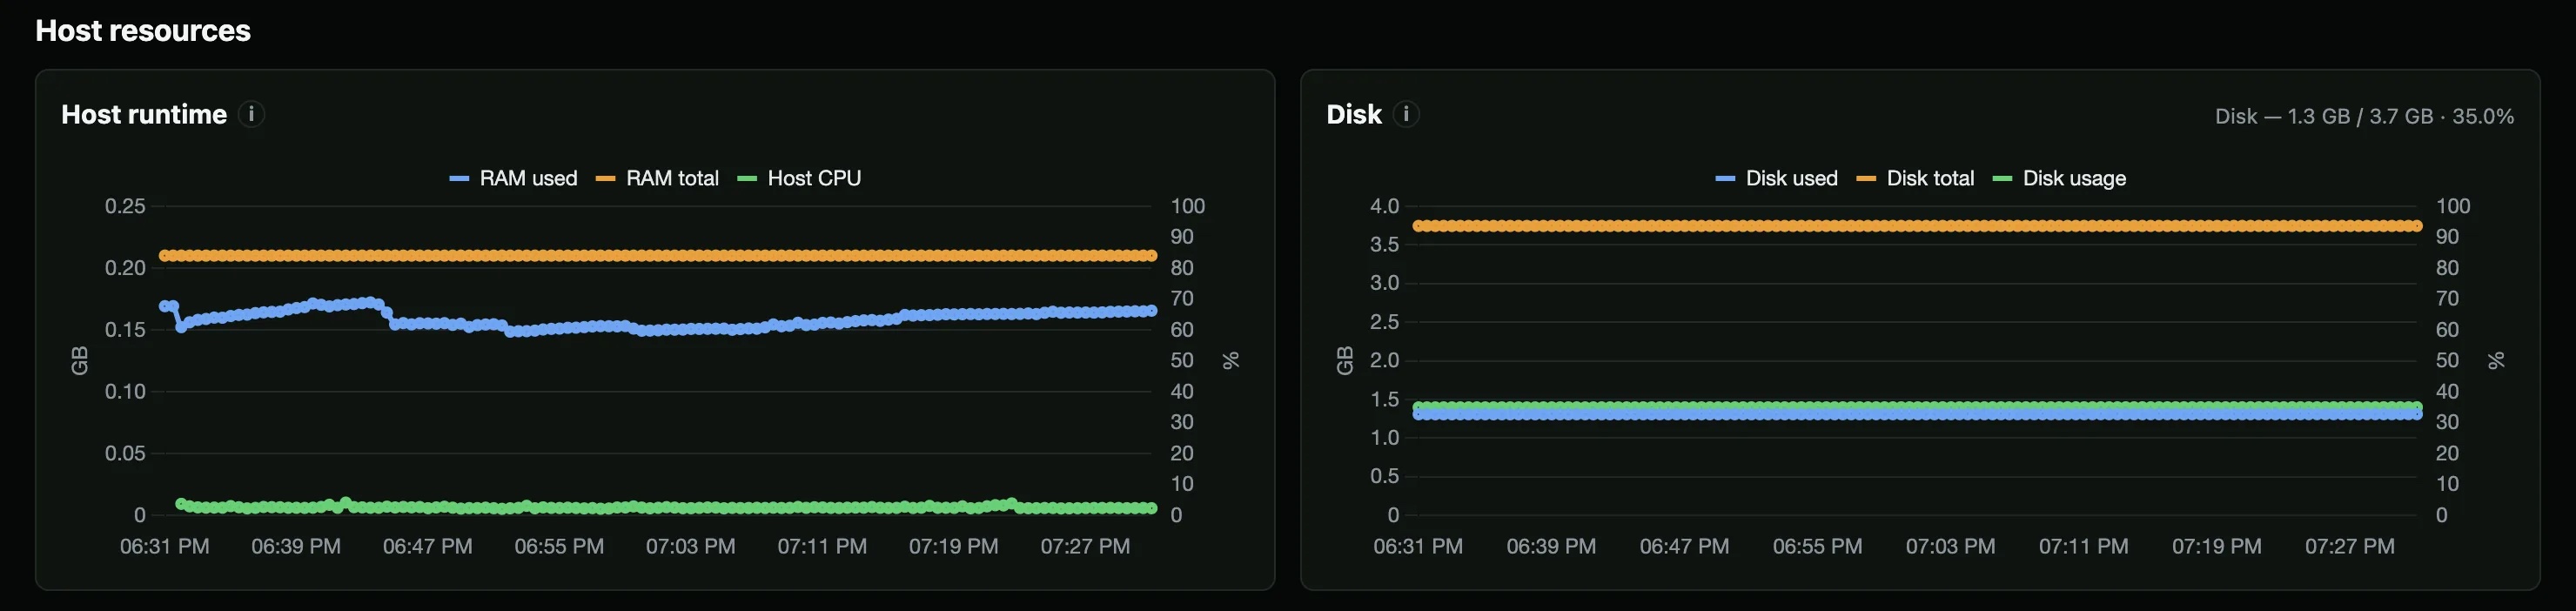
Single-binary monitoring for small servers and applications, with host metrics, HTTP errors, latency, and framework-aware integrations.
Built with
Go
About
A tiny self-hosted metrics dashboard for small servers. Spring Boot and Quarkus monitoring with SQLite, simple charts, and no Prometheus/Grafana stack required.
Screenshots
Get your badge
Add this to your site or README. It shows your live OSSDrop standing and links back — no account needed.
HTML
<a href="https://ossdrop.com/tool/statlite"><img src="https://ossdrop.com/badge/statlite" width="250" height="56" alt="StatLite on OSSDrop" /></a>Markdown
[](https://ossdrop.com/tool/statlite)Frequently asked
What is StatLite?
StatLite is an open-source devops & self-hosted tool — Single-binary monitoring for small servers and applications, with host metrics, HTTP errors, latency, and framework-aware integrations.
Is StatLite free and open source?
Yes. StatLite is free and open source, released under the MIT license. You can view and contribute to the source at https://github.com/PVRLabs/statlite.
What are open-source alternatives to StatLite?
Other open-source devops & self-hosted tools on OSSDrop include Kubernetes, Immich, Uptime Kuma, code-server.
Discussion (0)
A note from the maker· iamtechleadI built StatLite because I wanted useful application-level monitoring on small servers without running a full observability stack. It’s a single Go binary with built-in storage and dashboarding. It monitors host resources plus application signals like HTTP errors and latency, with integrations for Spring Boot, Quarkus, and StatLite’s simple metrics format. More integrations are in progress. I’m especially interested in feedback from people running small VPSes, homelabs, and lightweight self-hosted apps.
Sign in to comment.
No comments yet.
